1. 环境要求
需要JDK 1.5或更高版本。
2. 下载与安装
从JStockChart的站点中下载它的最新版本,当前版本是0.4.2。
解压JStockChart的zip文件(jstockchart-0.4.2.zip)后,将jstockchart目录中的jstockchart-0.4.2.jar和jstockchart/lib目录中的jcommon-1.0.16.jar和jfreechart-1.0.13.jar加到classpath中。
3. 示例
在JStockChart的发行包中,有一个demo目录。该目录包含了一个简单的例子,展示了如何利用JStockChart去生成时序图。demo目录中有一个Ant脚本build.xml,在该目录下执行命令ant即可运行该示例程序。下面是该示例的关键代码及其说明。
public class TimeseriesChartDemo {
public static void main(String[] args) throws IOException {
//
// 创建一个包含TimeseriesItem的List实例。
// 在此处,通过查询db4o的数据库文件,直接获得该List.
// 注意:所有的数据,都必须在"同一天"内。
List data = ;
// 创建SegmentedTimeline实例,表示时间区间"00:00-11:30,13:00-24:00"(即24小时中空缺了"11:31-12:59"这段时间)。
SegmentedTimeline timeline = new SegmentedTimeline(
SegmentedTimeline.MINUTE_SEGMENT_SIZE, 1351, 89);
timeline.setStartTime(SegmentedTimeline.firstMondayAfter1900()
+ 780 * SegmentedTimeline.MINUTE_SEGMENT_SIZE);
// 创建TimeseriesDataset实例,时间间隔为1分钟。
TimeseriesDataset dataset = new TimeseriesDataset(Minute.class, 1, timeline, true);
// 向dataset中加入TimeseriesItem的List。
dataset.addDataItems(data);
// 创建逻辑价格坐标轴。指定中间价为21,显示9个坐标值,坐标值的格式为".00"。
CentralValueAxis fixedPriceAxis = new CentralValueAxis(new Double("21"), new Range(
dataset.getMinPrice().doubleValue(), dataset.getMaxPrice().doubleValue()),
9, new DecimalFormat(".00"));
// 创建价格区域
PriceArea priceArea = new PriceArea(fixedPriceAxis);
// 创建逻辑量坐标轴。显示5个坐标值,坐标值的格式为"0"。
FixedNumberAxis fixedVolumeAxis = new FixedNumberAxis(new Range(dataset
.getMinVolume().doubleValue(), dataset.getMaxVolume()
.doubleValue()), 5, new DecimalFormat("0"));
// 创建量区域
VolumeArea volumeArea = new VolumeArea(fixedVolumeAxis);
// 创建时序图区域
TimeseriesArea timeseriesArea = new TimeseriesArea(priceArea,
volumeArea, createFixedDateAxis(DateUtils.createDate(2008, 1, 1)));
// 通过JStockChartFactory的工厂方法生成JFreeChart实例。
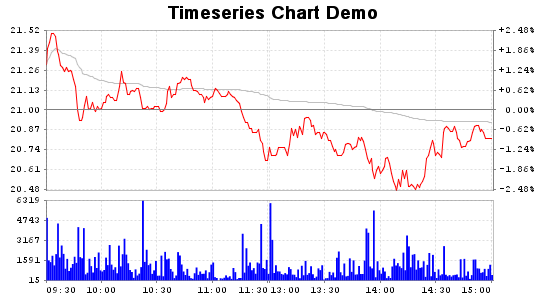
// 指定了该图的标题为"Timeseries Chart Demo",并且不生成图例(legend)。
JFreeChart jfreechart = JStockChartFactory.createTimeseriesChart(
"Timeseries Chart Demo", dataset, timeline, timeseriesArea, false);
// 创建图像文件。图像格式为PNG,长为545,宽为300。
ChartUtilities.saveChartAsPNG(new File(imageFile), jfreechart, 545, 300);
}
// 指定时期坐标轴中的逻辑坐标。
private static FixedDateAxis createFixedDateAxis(Date baseDate) {
FixedDateAxis fixedDateAxis = new FixedDateAxis(baseDate,
new SimpleDateFormat("HH:mm"));
fixedDateAxis.addDateTick("09:30", TickAlignment.START);
fixedDateAxis.addDateTick("10:00");
fixedDateAxis.addDateTick("10:30");
fixedDateAxis.addDateTick("11:00");
fixedDateAxis.addDateTick("11:30", TickAlignment.END);
fixedDateAxis.addDateTick("13:00", TickAlignment.START);
fixedDateAxis.addDateTick("13:30");
fixedDateAxis.addDateTick("14:00");
fixedDateAxis.addDateTick("14:30");
fixedDateAxis.addDateTick("15:00", TickAlignment.END);
return fixedDateAxis;
}
}
运行该示例程序后,可以生成如下图片:
4. 定制图表
由于JFreeChart具有高度的可定制性,所以当生成了JFreeChart实例后,你可以从中获取图表中的各个元素,如Plot,然后再定制它们的属性。详细信息请参见JFreeChart的站点和论坛。
另外,在创建JStockChart的XXXArea对象时,也可以直接定制若干属性。如,通过PriceArea类,可以设置价格线的颜色(PriceArea.setPriceColor),均线的颜色(PriceArea.setAverageColor);是否显示均线(PriceArea.setAverageVisible);是否显示涨跌幅(PriceArea.setRateVisible);...。详细信息请参见JStockChart的API文档。
分享到:


相关推荐
教你用ChatGPT一键生成时序图、类图、流程图、状态图以及用例图
这是博文《BitmapFactory.decodeResource VS BitmapFactory.decodeStream》中的时序图,发现上传后,看不清楚,所以上传在这里。
eclipse下生成Java类图和时序图,好多地方的链接和资源都是失效的这个是新的,搭配eclipse 4.4.2版本使用,不同版本直接有差别,不保证别的版本也可以用。
时序图生成利器,再也不用visio或者word画时序图了,特别好用,推荐
该资源中包含两个“时序图”,是使用专业绘图软件Visio绘制的。这两个时序图都很详细,是针对代码进行绘制的,可以用于计算机毕业设计的论文中对于“系统详细设计”部分中时序图,总之是很好的一个资源!建议需要的...
Springboot启动时序图https://blog.csdn.net/u010811939/article/details/80592461讲解博客
uml时序图画法,项目过程中到的。 UML时序图画法,有详细步骤和例子
利用UML实现汽车销售的时序图,步骤清晰,简明。其中包括交易中可能出现的各种角色
I2C时序图的详细讲解,简易时序图,经典I2C测试讲解。
这是我从郭天祥的视频中整理出来的详细的时序图,还有注释!
astah时序图linux版astah时序图linux版astah时序图linux版astah时序图linux版astah时序图linux版astah时序图linux版astah时序图linux版astah时序图linux版astah时序图linux版astah时序图linux版astah时序图linux版...
有时候我们需要用到序列图或者循序图,徒手画会非常浪费时间,TimeGen应该能帮到你,它是一款非常专业的画时序图软件,它能快速容易的画出时序图,而且可直接复制到word文档中,非常方便实用! TimeGen功能特色 ...
有时候产品要画简单的时序图,但是可用的工具很有限,visio、亿图、帕拉丁。其实axure就可以画出很美观的时序图
CAS单点登录时序图,UML源码
Eclipse导出类图时序图,亲测 有效,最新版eclipse也可用 网上找的最新的也是16年的,比较老,或许因为eclipse比较新,不能用 这个亲测有效 详细安装截图
有两个PDF 教你看懂时序图和怎样读芯片数据手册.pdf 对于学看数据手册是很有帮助的
UML建模时序图,关于各种图表都有,时序图(Sequence Diagram)是显示对象之间交互的图,这些对象是按时间顺序排列的。顺序图中显示的是参与交互的对象及其对象之间消息交互的顺序。时序图中包括的建模元素主要有:...
moto6800接口协议时序图,比较有用,查问题时可以对照对照
详细的介绍数字电路的时序图的看法 并有详细的例子
本文档所展示的是时间序列课本中所须学习的时序图和自相关图,我们采用案例的形式,通过具体实例更加清晰明确的学好时序图和自相关图,实践出真知。